
Section 4: Raising the money · Chapter 19
Manage capacity to manage inflation
Reading time: 17 minutes
In this section
We’ve got a promise to keep. In Chapter 8 we set out the mechanism of inflation and said we’d explain how spending gets matched to capacity. Here it is.
The dinner-table version is that prices rise when something is scarce and lots of people want it. There are PhDs written on the nuances. The dinner-table version is close enough.
No serious economist has claimed sovereign governments can create or borrow money without consequence. The claim here is narrower, and it’s accurate: money created to build what a country physically lacks, at a pace that country can physically absorb, does not behave like money created to chase goods that have inelastic supply.
So the question is what the money buys.
Retrofitted homes. Social housing. Generation and grid. Water that doesn’t leak. Buses and trams that turn up. None of it arrives on next day delivery by Amazon Prime. These are projects measured in years.
Each has at least two costs. Wages and materials. Some also need land.
Land is the simplest. Buying a field consumes no bricklayers and no steel. It transfers a title. Money spent on land changes who owns something. It doesn’t compete for the resources that build things.
Wages are the largest cost in the programme. And wages are paid here, in sterling, and spent here.
Follow the money
A welder on £40,000. Her employer pays £5,250 in National Insurance on top, so the job costs £45,250. Income tax takes £5,486 of her salary. Her own National Insurance takes £2,194.
Before she has spent a penny, the Treasury holds £12,930 of the £45,250 that job cost. Nearly 29p in the pound.1
Then she spends it. VAT on the shopping. Duty on the beer. The pub pays business rates on the building and corporation tax on the profit, and income tax and National Insurance on the wages of the lad who pulled the pint. Who spends it again.
The Office for Budget Responsibility works on the basis that around 40% of the GDP an investment creates returns to the Treasury as tax.2
One thing about that figure. The OBR is required to forecast on stated government policy — not proposed policy, not plausible policy. It has never modelled the programme in this report, and it will not unless a government adopts it.
That is not a criticism. It is the job it was given. But it means the official numbers describe the country we have, not the one we could build.
Others have modelled it. The Confederation of British Industry (CBI) puts the return on construction spending at £2.92 for every pound. The International Monetary Fund (IMF) finds the effect of public investment builds over years rather than fading, and is strongest where there is slack in the economy – the condition the capacity guardrail exists to create. A worked study of a national retrofit programme put the return at £3.20 of GDP and £1.25 of tax per pound.
Different methods. Different questions. Different answers.3
So take the official one. The OBR’s working assumption is that a pound of public investment produces a pound of GDP. At 40%, the Treasury gets 40p back. The real cost to the state is 60p in the pound, and we own the asset at the end.
A private investor recovers none of that 40p. It was never theirs to recover. That is the whole difference, and it’s why the state can build what the market will not.
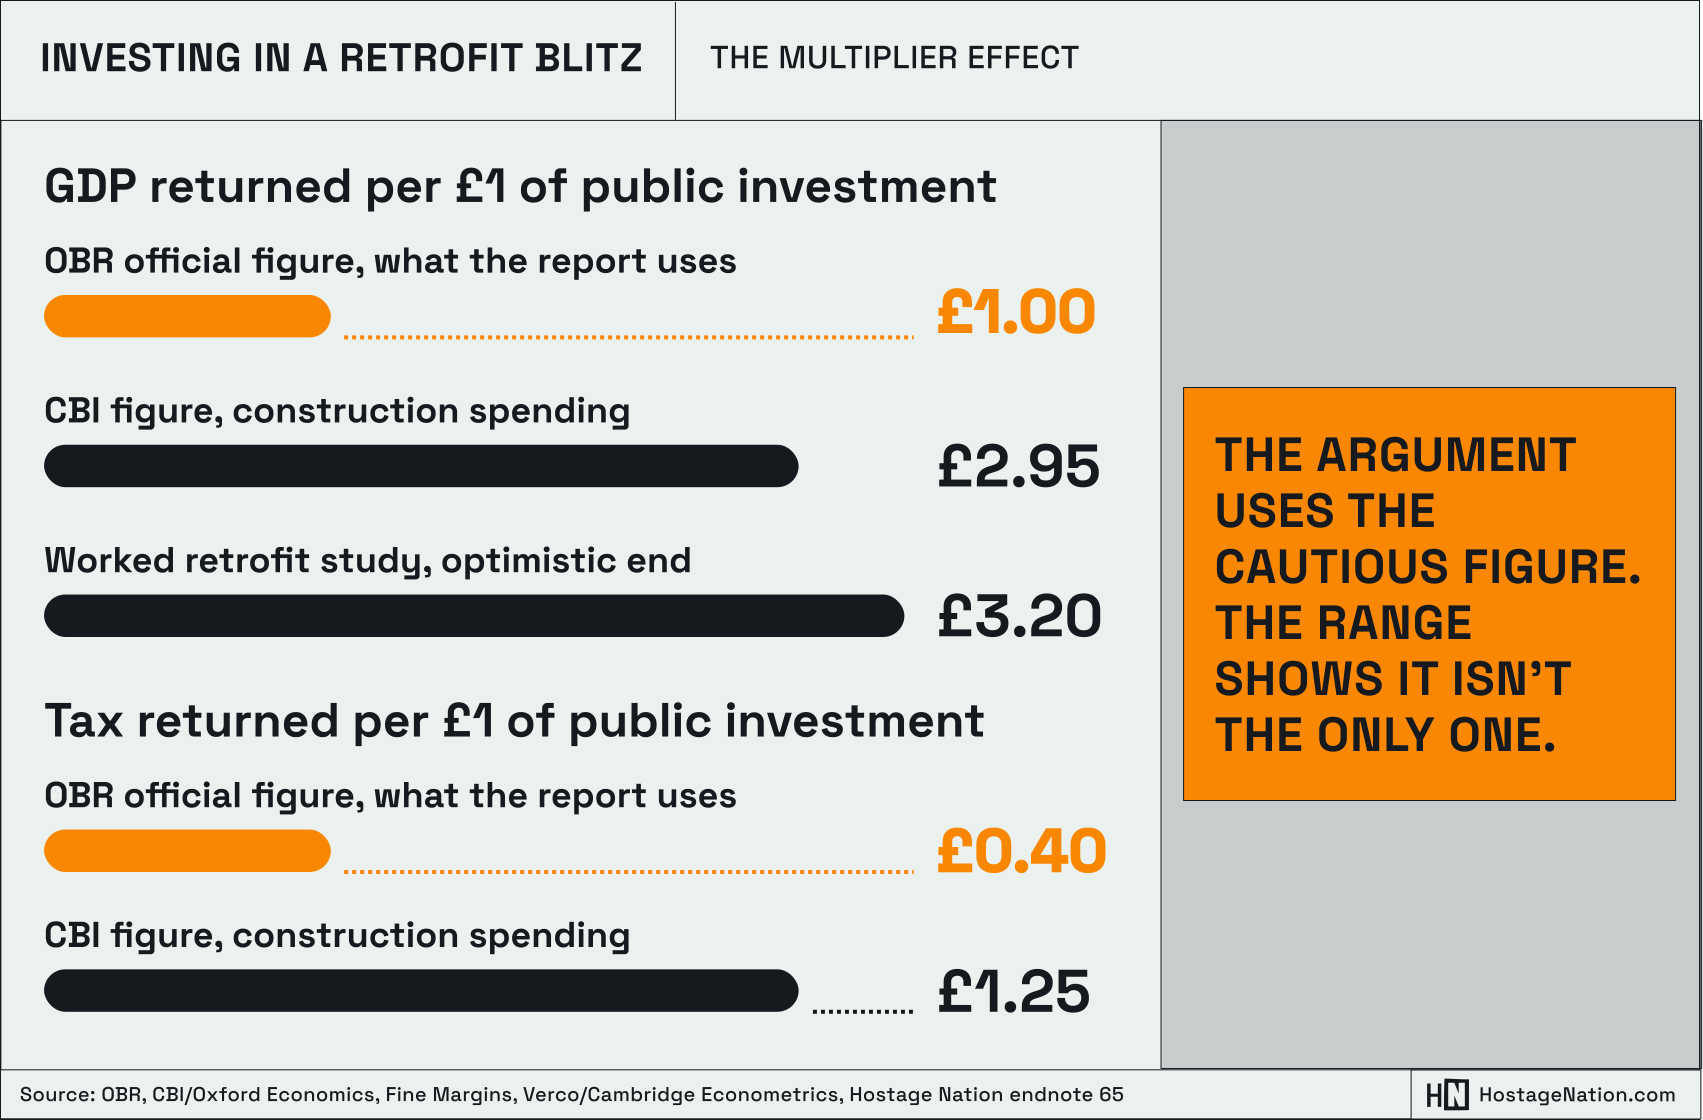
Text description for Investing in a retrofit blitz: the multiplier effect
GDP returned per £1 of public investment
- OBR official figure, which the report uses: £1.00
- CBI figure, construction spending: £2.95
- Worked retrofit study, optimistic end: £3.20
Tax returned per £1 of public investment
- OBR official figure, which the report uses: £0.40
- CBI figure, construction spending: £1.25
The point made: the argument uses the cautious figure, and the range shows it isn’t the only one. Source: OBR, CBI/Oxford Economics, Fine Margins, Verco/Cambridge Econometrics, Hostage Nation endnote 65.
Keynes named the leaks
Money escapes the circuit three ways: savings, imports, tax.
Only two of them cost the state anything.
Tax is not a leak from the Treasury’s point of view. It is the return. A private firm loses everything that isn’t its own margin. The state loses savings and imports, and recovers the third at every round, from everyone who touches the money.
Savings we have already addressed. National Development Stock offers ISA and pension savers a secure investment at a fair rate, and puts the money back to work.
Imports are the rest of this chapter.
The supply chain is the argument
Order a million heat pumps from an overseas manufacturer and we have let ourselves down. That money is gone. No cascade, no tax, no wages spent on any British high street.
Build them here and the whole circuit runs.
This is not a call for protectionism. No tariffs. No import quotas. No shelter for firms that can’t compete. What we should offer is a full order book to anyone who can supply, the skills training to build the capacity to do it, and social value clauses that make the work worth having.
“Certainty of demand is the thing British industry has never been given. A firm that knows the orders are coming for twenty years will expand the factory. A firm guessing at next year’s budget will not.”
That hits hardest for small firms. A large contractor can carry uncertainty on its balance sheet for a year or two. A firm of eleven people carries it on an overdraft, and cannot bid for work it might not be able to finance. It is not that small firms lack the skill. It is that certainty is worth more to them per pound than to anyone else, and they have never been given any.
Social value clauses are where that gets fixed. The 2012 Public Services (Social Value) Act has long allowed public procurement to embed clauses for social good – fair wages, high environmental standards. The 2023 Procurement Act takes this further. So we already have the legal powers to break contracts into lots a regional firm can actually bid for. Require apprenticeships. Require the skills and jobs to be created here. And apply the one condition that costs the Treasury nothing at all: everyone in the chain gets paid on time.4
Thirty-day payment terms are already legally implied into public contracts and already required to flow down the supply chain. They are widely ignored, because the consequence of ignoring them is a published statistic, and a power nobody uses. Make payment performance a condition of holding the contract, and the smallest firm in the chain stops lending money to the largest.
Why the state can pay more
A contractor is building a wind farm. Two quotes for the fabrication. £750 million from a yard on the Tees. £748 million from overseas, shipping included.
The contractor takes the cheaper one. Of course it does. Two million pounds is two million pounds, and the contractor’s job is to build the wind farm as cheaply as it can.
Run the same decision through the Treasury’s books.
£750 million spent on the Tees returns something in the order of £300 million in tax. £748 million spent abroad returns close to nothing.
The state is around £298 million better off paying £2 million more.
The contractor cannot see that. No private company collects income tax. It sees a price, and it is behaving perfectly rationally in taking the lower one. The failure is not the contractor’s. It is an appraisal system that scores the price of a project and ignores where the money lands.
Of course, this requires the capacity to supply, which is itself dependent upon a clear demand signal. The state’s advantage is real only when it puts workers and machines to work that would otherwise be still. Which is exactly what the guardrail measures.5
The real value of work
The £300 million is only the tax. It is not the whole return.
A welder in work is a welder not on Universal Credit – around £11,500 a year for the average household, more where there’s a health element. Council tax support on top. She is less likely to need the NHS. Her town has less crime. Her children grow up in a house with a wage coming in.
And the scarring stops. Someone who gets a trade at eighteen pays tax for forty-five years. Someone who gets three years of app work and then gives up costs the state for forty-five years. The decision runs the same distance in both directions.
The Treasury knows how to count all this. It maintains a database of these costs, and requires a council bidding for an employment programme to use it.
But it does not require anyone to use it when deciding where a wind farm’s steel gets made.6
What we owe the world
Britain buys more from the world than it sells, and has done every year since 1984. Recent deficits have run at roughly two to four per cent of everything we produce. Spend heavily at home while that gap stays open and sterling comes under pressure. A weaker pound makes every imported component dearer, including the silicon wafers and cables this programme runs on.7
Be fair about it, though. A weaker pound also makes British exports cheaper, and that is supposed to be the adjustment mechanism. Right now it is not working. What we import is mostly essentials – energy, food, components – so when the price rises we pay it, because essentials are essentials. And when the rate turns in our favour, we cannot take advantage, because in industry after industry we no longer have the plant or the workforce to scale up. Britain gets the loss and misses the gain.
That is not an argument against having a floating currency. It is an argument for rebuilding industrial capacity.
The rate moves anyway
Sterling’s value is not set by the British government. It floats based on market events. A rate rise in Washington. A flight to the dollar when a war starts. A shift in what global investors think of emerging markets, which has nothing to do with us at all. The pound moves, and the price of everything Britain imports moves with it – under any government, pursuing any programme, including doing nothing.
We have seen this argument before in this report. It is the same one made about gilt yields: a price this country depends on, set by people responding to events on the other side of the world.
You cannot make that volatility go away. What you can decide is how much of your national life is exposed to it.
What the money buys
Our programme is aimed at the imports causing the problem. Britain burns imported gas to heat badly insulated houses. Retrofit cuts the demand. A sovereign grid replaces the supply with clean electricity generated here. Cambridge Econometrics modelled the insulation alone and found gas imports 26% lower than they would otherwise be. That is before a single boiler is replaced. That is the trade gap closing, not widening.8
There is a second drain nobody mentions. Stop dividend flight. Our water companies, energy networks and airports are largely foreign-owned, and the dividends leave every year, permanently. Building capacity does not fix that. Only changing the ownership does, and the moment it changes, the outflow stops.
Then there is what we sell. Trained engineers, plant that runs at scale, firms clustered around a guaranteed order book – that’s how a country becomes competitive in export markets. Britain does badly in industries where we lost the capacity to compete. Coordinated, long-term investment is the fix.
Be honest about the sequencing, though. We buy the heat pumps before we stop buying the gas. There is a window, some years long, where the imports come first and the savings arrive later. That is not an argument for continuing to import gas. It is an argument for building those supply chains here, now, at the pace the guardrail sets.
“A country that heats its homes with its own electricity, houses its people in homes it built, and moves them on transport it owns is a country that needs less foreign currency. That is not protectionism. It is the difference between weathering the next shock and being hostage to it.”
First we build capacity
Which brings us to the rule that governs the whole programme.
Provide certainty of demand for labour and production. Then train the workers and build the supply chains. Then, and only then, fund the projects, in line with the capacity that exists to deliver them. But where they know that the money will be there when the capacity comes online.
Not a spending total announced in a Budget and dumped into a market overnight. Tranches, released against a measured answer to a simple question: can Britain physically build this yet?
That is what the capacity guardrail is for. Not immunity from inflation. A mechanism for spotting it early and easing off.
The machinery for measuring it already exists, and we set out how it works in Chapter 28, including who assesses capacity, how the skills pipeline is built, and where the engineers come from.
- Worked at 2026/27 rates. On a salary of £40,000, the employer pays National Insurance at 15% on earnings above the secondary threshold of £5,000, giving £5,250 and a total employment cost of £45,250. The employee pays income tax at 20% on earnings above the personal allowance of £12,570, giving £5,486, and National Insurance at 8% on the same band, giving £2,194. Total receipts to the Exchequer from the employment itself are £12,930, or 28.6% of the cost of the job. The personal allowance, the higher rate threshold of £50,270 and the employer secondary threshold are all frozen until April 2031. Small employers can offset up to £10,500 of employer National Insurance through the Employment Allowance, which reduces the first-round figure for a small contractor but is immaterial for a large one. Rates from House of Commons Library, Direct taxes: rates and allowances for 2026/27. ↩︎
- Office for Budget Responsibility, Economic and Fiscal Outlook, October 2024, Box 3.3, page 82 (obr.uk/efo/economic-and-fiscal-outlook-october-2024), drawing on Suresh, N., Ghaw, R., Obeng-Osei, R. and Wickstead, T., OBR Discussion Paper No. 5: Public investment and potential output, August 2024. The OBR estimates the real economic internal rate of return on public investment, measured as GDP produced per pound of upfront cost, at around 9%, rising to 13% when the additional GDP from induced business investment is included. The corresponding fiscal return to the public finances is around 2%, rising to 3%. The difference between the economic and fiscal figures arises because the Treasury captures only part of the GDP created; the OBR’s calculations assume an effective tax rate of 40%. That 40% assumption is the figure used in this chapter. It should be read as an average across the whole cascade of activity an investment generates, not as a rate applying to any single transaction. ↩︎
- The stated-policy constraint arises from the Budget Responsibility and National Audit Act 2011, which requires the OBR to prepare its forecasts on the basis of current government policy. The OBR describes the position itself: it is no better equipped to see into the future than other forecasters, and is subject to constraints others are not, including the legal requirement to condition its central forecasts on stated rather than anticipated government policy. Comparators. Confederation of British Industry and Oxford Economics, Fine Margins, February 2020, which puts the value created by construction spending at £2.92 per £1 and updates an earlier L.E.K. Consulting estimate of £2.84. This is a gross output multiplier derived from input-output modelling, covering direct, indirect and induced effects; it is not a fiscal multiplier and is not directly comparable with the OBR’s. The same applies to the retrofit figure. International evidence: Abiad, Furceri and Topalova, The Macroeconomic Effects of Public Investment: Evidence from Advanced Economies, IMF Working Paper 15/95, and Journal of Macroeconomics, 2016. An unanticipated increase in government investment worth 1 percentage point of GDP raises output by about 0.4% in the same year and around 1.5% after four years in advanced economies. Demand effects are stronger where there is economic slack and monetary accommodation, and under those conditions the public-debt-to-GDP ratio may decline. Note that the IMF’s same-year figure is below the OBR’s assumption of 1; the difference between them is persistence rather than magnitude. On horizon: the OBR’s own modelling of a public investment uplift worth 1% of GDP shows the effect on GDP rising over time — around 0.5% after five years, and 2.5% over fifty. The benefits are therefore at their smallest at the point the fiscal rules take their reading. Against all of this, three concessions. The Resolution Foundation’s evidence to the Treasury Committee estimates that independent fiscal institutions reduce government borrowing costs by the equivalent of £37-55bn a year at current UK debt levels. Julian Jessop of the Institute of Economic Affairs told the same inquiry that the widespread belief that the OBR’s forecasting record is poor is largely unjustified. And former chair Richard Hughes told the Committee that OBR forecasts were more accurate and less biased than Treasury forecasts over the first three years of the forecast horizon, though wider of the mark in years four and five. The Treasury Committee inquiry The OBR: 15 Years On, opened December 2025, was still taking evidence in June 2026. ↩︎
- The Public Services (Social Value) Act 2012 requires contracting authorities in England and Wales to consider, before procuring services above threshold, how what is proposed might improve the economic, social and environmental well-being of the relevant area. It is a duty to consider at the pre-procurement stage rather than a power to impose conditions; Scotland operates under the Procurement Reform (Scotland) Act 2014. The operative powers are in the Procurement Act 2023, in force from 24 February 2025 and not retrospective, so procurements commenced before that date remain under the Public Contracts Regulations 2015.
Section 18 requires a contracting authority, before publishing a tender notice, to consider whether the goods, services or works could reasonably be supplied under more than one contract and whether those contracts could appropriately be awarded by reference to lots; an authority that decides against lotting must give reasons. Section 19 replaces the most economically advantageous tender with the most advantageous tender.
Section 13 requires most authorities to have regard to the National Procurement Policy Statement, published 13 February 2025, which directs public bodies to spend more with small businesses, charities and social enterprises, to secure good employment conditions, and to take account of priorities in local and regional economic growth plans.
Procurement Policy Note 002 sets a minimum 10% weighting for social value in the overall score and requires social value commitments made during procurement to be reflected in the contract as terms or performance indicators; these requirements are mandatory for central government departments, executive agencies and non-departmental public bodies, and discretionary for other public bodies. One limit should be stated plainly.
Section 23 requires award criteria to relate to the subject matter of the contract, which permits criteria on skills, apprenticeships and employment but not a requirement that suppliers be local. The Government’s consultation Public Procurement: Growing British industry, jobs and skills identified this as an obstacle to targeting benefit where it is most needed and proposed removing the restriction in specified circumstances; the Government published its response on 26 March 2026, and no legislation has followed. Local benefit is at present achieved through lot structure and through employment and skills criteria, not through a locality condition.
On payment: sections 68 and 73 of the Act imply thirty-day payment terms into every public contract and every public sub-contract, whether or not the parties write them in, and section 68(6) provides that any term purporting to restrict or override them is without effect; section 88 applies the same terms to regulated below-threshold contracts. The equivalent provision for earlier contracts is regulation 113 of the Public Contracts Regulations 2015. Enforcement is the weak point rather than the drafting.
Section 69 requires authorities to publish payment compliance notices every six months, in force from 1 October 2025. Schedule 7 makes poor payment performance a discretionary ground for exclusion, and an authority may terminate a contract for a supplier’s failure to pay its sub-contractors, but both are discretionary and neither is routinely used. For major central government contracts a Cabinet Office procurement policy note already makes payment performance a selection threshold at the bidding stage, requiring suppliers bidding for contracts above £5 million a year to pay 95% of invoices within 60 days and within an average of 45 days.
The proposal here is narrower and different in kind: to make continuing payment performance a condition of holding the contract, applied across the public sector rather than to central government’s largest procurements. ↩︎ - Two conditions govern whether the effect is real. The first is slack: if the capacity would have been fully employed in any case, the tax receipts would have arisen anyway and no additional return is generated. The second is displacement: where workers are drawn from other employment rather than from unemployment, the net fiscal gain is smaller than the gross figure suggests. Both are reasons to pace investment against measured capacity rather than to assume the return. ↩︎
- The database referred to is the Unit Cost Database, which brings together more than 600 cost estimates covering crime, education and skills, employment and economy, fire, health, housing and social services, most derived from government reports and academic studies. Its derivation and underlying calculations were quality assured by New Economy in co-operation with HM Government, and it is intended to allow project managers to forecast the costs and benefits of a programme before undertaking detailed cost-benefit analysis. It is used routinely in local authority and combined authority business cases. The estimates require uprating, having been compiled some years ago.
No attempt is made here to put a figure on the wider costs avoided. Doing so credibly would require assumptions about how many workers would otherwise have been unemployed and how many were drawn from other employment, which is beyond the scope of this report. The mechanisms are well established: benefit expenditure falls, health costs fall, and long spells out of work are known to depress a person’s earnings for years after they return, with the effect most severe for the young. ↩︎ - The UK has recorded a current account deficit in every year since 1984 (Office for National Statistics, Balance of payments, UK: October to December 2025, released 31 March 2026). The deficit was £63.2 billion, or 2.2% of GDP, in 2024, narrowing from a revised £98.3 billion, or 3.6% of GDP, in 2023 (ONS, UK Balance of Payments, The Pink Book: 2025, released 31 October 2025) ↩︎
- Washan, P., Stenning, J. and Goodman, M., Building the Future: The Economic and Fiscal Impacts of Making Homes Energy Efficient, Verco and Cambridge Econometrics, October 2014. The 26% figure is modelled output, not observed data. It is the projected reduction in natural gas imports against a do-nothing baseline, under a scenario in which a national home retrofit programme is funded and delivered as infrastructure investment rather than as a series of time-limited schemes. Import substitution is the principal driver of the wider economic gains the modelling reports. The modelling dates from 2014, so the size of the gain moves with gas prices and it should be read as indicative of direction rather than as a current estimate. The programme, the investment assumptions behind it and the full set of results are set out in Chapter 21. The modelled programme is one of fabric energy efficiency — insulation, glazing and heating efficiency, bringing the housing stock up to a defined standard. It does not assume the replacement of gas boilers with heat pumps, which were not a material part of UK housing policy at the time. The 26% is therefore attributable to reduced demand for gas rather than to fuel switching, and should be read as a floor rather than a ceiling for the effect of the wider programme described in Chapter 21. ↩︎